MARKET UPDATE - July CPI Report Showed Virtually Across-The-Board Disinflation
Dear Landlords,
I want to extend a warm welcome to all our new members! We recommend that you start by reading our Welcome Letter by clicking here. It explains why we invest in real estate through REITs and how to get started.
As a reminder, our most recent "Portfolio Review" was shared with the members of High Yield Landlord on August 7th, 2024, and you can read it by clicking here.
You can also access our three portfolios via Google Sheets by clicking here.
New members can start researching positions marked as Strong Buy and Buy while taking into account the corresponding risk ratings.
If you have any questions or need assistance, please let us know.
==============================
MARKET UPDATE - July CPI Report Showed Virtually Across-The-Board Disinflation
The recently released July CPI report showed yet again that the post-COVID inflationary shock is all but over and that the consumer pricing environment is more or less returning to its pre-pandemic state.
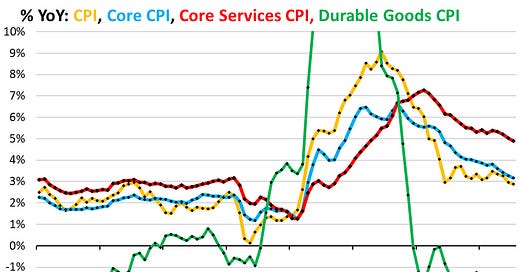
This chart illustrates the shock and its aftermath nicely:
In 2020, because of COVID, inflation briefly slumped to ultra-low levels. Then, in 2021, as vaccines were distributed and the economy was reopened, inflation took off like a rocket.
Even from mid-2020, durables inflation soared, going literally off the charts in 2021. But the prices of virtually everything increased at an above-average rate in 2021-2022. Since 2023, however, the rate of price growth of most consumer goods and services has been declining, a process otherwise known as "disinflation."
Durable goods, such as cars, furniture, and appliances, are now seeing meaningful deflation, as prices fell 4.1% year-over-year on average in July.
While all of the commonly cited inflation metrics such as CPI, core CPI, PCE, and core PCE all remain above the Fed's 2% target, real-time consumer inflation has been lower than 2% for over a year now.
As we've explained many times in the past, the primary factor holding up these official inflation metrics is the way the Bureau of Labor Statistics measures housing/shelter inflation.
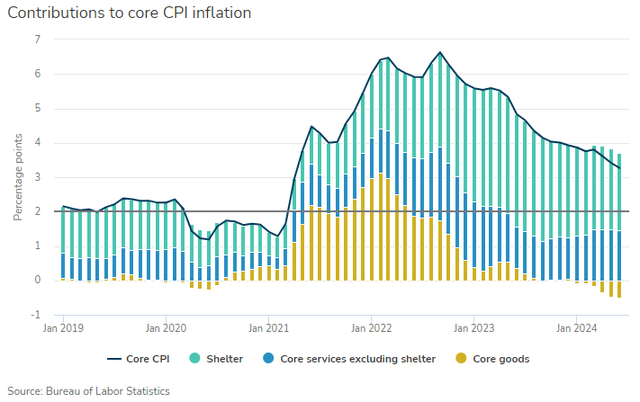
Since the 2nd half of 2022, the biggest contributor to the year-over-year CPI rate has been shelter.
Inflation in core services ex-shelter have remained above their pre-pandemic level largely due to post-COVID "revenge spending" on travel, leisure, recreation, and restaurants (things they couldn't do during lockdowns), but goods inflation flatlined in 2023 and has gone increasingly negative in 2024.
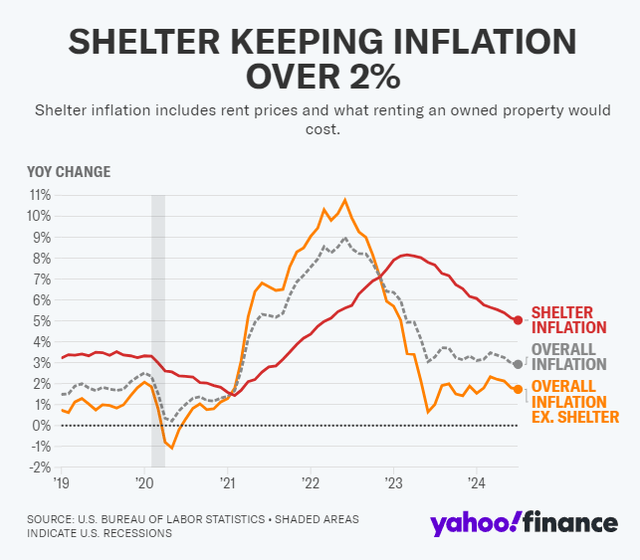
As we can see below, CPI ex-shelter slid further from 1.8% in June to 1.7% in July.
We know regular readers of these CPI analyses are getting tired of hearing this, but it bears repeating: If the Fed measured shelter costs using real-time market data instead of the BLS's lagged metrics, overall inflation as measured by the CPI would have been below 2% since the Summer of 2023.
Let's dig in to the July CPI report to gain a better grasp of the degree of disinflation we are seeing in consumer goods and services.
Mysterious Uptick In Housing CPI Metrics
Keep reading with a 7-day free trial
Subscribe to High Yield Landlord to keep reading this post and get 7 days of free access to the full post archives.


