MARKET UPDATE - Disinflation Continues, Even If The CPI Doesn't (Yet) Show It
Please note that this is a free article of High Yield Landlord. If you find it valuable, consider joining our service for a 2-week free trial. You'll gain immediate access to my entire REIT portfolio, real-time trade alerts, exclusive REIT CEO interviews, and much more.
MARKET UPDATE - Disinflation Continues, Even If The CPI Doesn't (Yet) Show It
The Bureau of Labor Statistics recently released its CPI report for February 2024, which showed a month-over-month rise of 0.4% (slightly higher than expected) and a year-over-year increase of 3.2%.
Naturally, many investors will look at the chart below and think that the disinflationary trend of 2H 2022 and 1H 2023 has stalled.

Cue more headlines including phrases like "sticky," "stubborn," "hotter than expected," and perhaps even "reaccelerating."
Torsten Slok of Apollo Global Management even re-shared this chart showing the supposedly grave risk that the Fed cutting rates too soon could cause inflation to reaccelerate, just like the the 1970s.
But as we discussed in "MARKET UPDATE - Is A 1970s-Style Resurgence in Inflation Coming?", today's situation is very dissimilar to that of the 1970s.
Although history sometimes rhymes, it rarely repeats in the manner that this chart above suggests.
In fact, we don't think history is even going to "rhyme" with the 1970s in this case. We think the disinflationary trend will continue for at least another year or so. Thereafter, unless we experience another fiscal or economic shock, the future looks more likely to "rhyme" with the pre-pandemic era of low inflation.
So, if the disinflationary trend remains intact, why is the CPI not showing it?
Two reasons:
The shelter component of CPI only very slowly and gradually responds to real-time changes in housing costs. It smooths out housing inflation's peaks and troughs over time, as we've explained in previous articles.
As we explained last month, the only consumer price that can rightly be considered "hot" is motor vehicle insurance, but these price increases are merely a ripple effect of prior increases in car and auto maintenance prices.
Given the fact that the market treats REITs as bond proxies as well as the fact that long-term interest rates likely won't fall further until the CPI falls further, it is disappointing that real-time inflation is taking so long to filter into the CPI.
But we believe the narrative that interest rates will have to stay higher for longer because of "stubbornly sticky" inflation is false. Paradoxically, the February CPI report bolsters our view that the disinflationary trend remains in place and will continue for the foreseeable future.
Below, we explain why.
Digging Into February CPI
The following image of the February CPI components breakdown has very small print, but if you click on it, it should become larger on your screen.
As you can see, there are essentially four primary items of the CPI that are significantly above 2% YoY:
Food away from home (~5.5% weighting in the CPI)
Electricity (~2.5% weighting in the CPI)
Shelter (36% weighting in the CPI)
Transportation services (~6.5% weighting in the CPI)
Let's address them one by one.
Food Away From Home
Anyone who has been to a restaurant anytime recently knows that eating out is a lot more expensive than it was 3-4 years ago. It is still jarring to see the bill at the end of a meal.
But the important thing as far as inflation is concerned is that the rate of price increases has slowed considerably in recent months. In fact, the YoY food away from home metric showed a sharp drop from 5.1% in January to 4.5% in February.
In the last 6 months, annualized food away from home prices rose 3.4%. In the last three months, annualized food away from home prices rose 2.2%.
The rate of restaurant price growth is falling rapidly. This is a very strong disinflationary trend.
Clearly, the post-pandemic "revenge spending" at restaurants and other out-of-home food and beverage settings is coming to an end.
Electricity
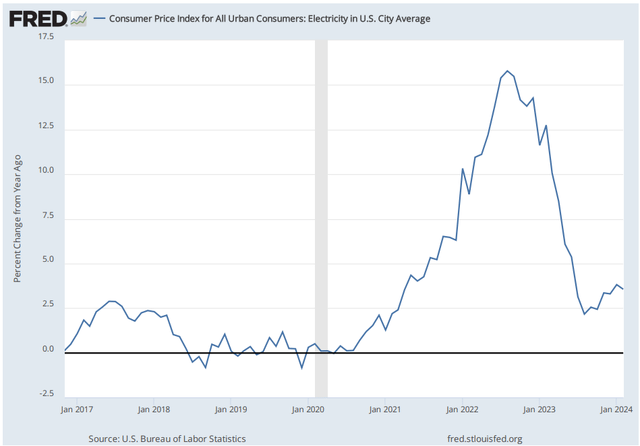
While electricity prices spiked in 2021 and 2022, there was a strong disinflationary trend for much of 2023. That disinflationary trend appears to have halted and reversed from the second half of 2023 up to today.
What's going on here?
Well, there are three primary inputs into electricity prices: fuel costs, capital expenditures, and interest rates.
Fuel costs are largely captured in the PPI metric for electric power utilities (red line below). While utilities' input costs surged in 2021 and 2022, those costs have fallen by double-digit rates in 2023 and into 2024.
Since utilities' power generation is increasingly coming from natural gas and renewable energy (most importantly the former), input costs are heavily determined by natural gas prices.
That's why the chart of electric utility PPI tracks very closely with the price of natural gas in the United States:

A mild winter combined with President Biden's order to halt new LNG exports appear to have caused the most recent leg down in gas prices, which should be good for utilities and ultimately for customers.
While it is possible that the rate increases getting pushed through by regulated electric utilities right now are partly caused by past input cost increases, the more likely culprits for higher electricity prices are higher capital expenditures and interest expenses.
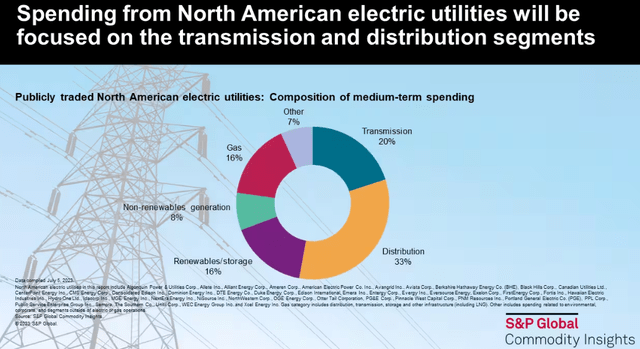
Utility capex increased at a 7% compound annual rate from 2010 through 2022, and that growth rate looks likely to increase in the coming years. Utilities are spending aggressively on upgrading aging infrastructure, weatherizing existing assets, expanding transmission & distribution lines, building renewable energy & storage facilities, and enhancing efficiency through smart meters and other technological improvements.
Most of the upgrades required to integrate new renewable and storage assets into the grid are included in the transmission segment, which includes long-distance, high-voltage power lines as well as new electrical substations.
Meanwhile, distribution is the "last mile" of electric power delivery -- the lower voltage, overhead or underground power lines that connect substations to end-users. This spending is spurred from construction of new buildings as well as replacements or upgrades of existing infrastructure assets.
Since regulated utilities have predetermined rates of allowed return on equity, both higher interest expenses and capex costs can be passed through to customer bills, albeit not immediately.
Electricity inflation may continue to stay above pre-pandemic levels for a while, but given the fact that electricity has only a 2-3% weighting in the CPI, it should remain a very small contributor to overall inflation going forward.
Shelter
The shelter component of the CPI is by far the biggest and most important one right now. We have discussed how this metric lags real-time housing costs ad nauseum in past articles, so we won't go into depth on that again here.
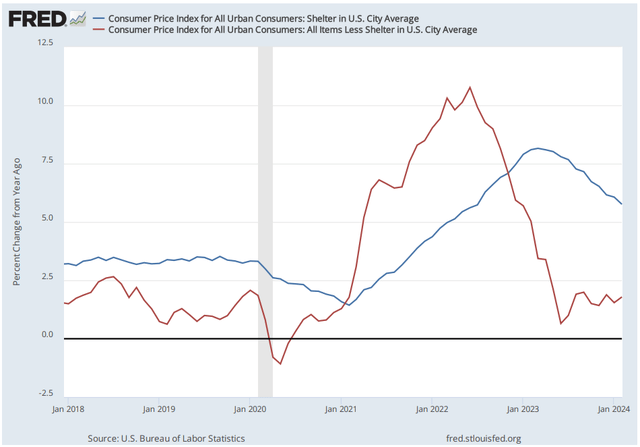
The bottom line is that shelter CPI definitively peaked about a year ago and has been in disinflationary mode since then.
Just as shelter CPI was late to recognize real-time housing costs rising, it is now late to recognize falling housing costs. It is building in housing costs, but only slowly and with a lag.
YoY shelter CPI dropped in February to 5.8% from January's 6.1%.
Shelter CPI peaked about a year after real-time rent rates peaked, and the same lag will likely be seen on the downside. According to Apartment List, YoY rent growth troughed in the Fall of 2023, so we should not expect shelter CPI to trough until the Fall of 2024.
The reason shelter is so important (and frustrating!) is that it accounts for such a large share of the CPI and PCE and therefore is the primary factor keeping the official inflation metrics above the Fed's stated 2% target.
Once again, CPI ex-shelter in February came in at 1.8%, the 9th consecutive month below 2%.
And once again, if you averaged the February YoY rent changes reported by Apartment List, Zillow, and Redfin and substituted them for the shelter component of the CPI, the headline CPI rate would have been 1.7%.
Then again, there is one sub-component of shelter CPI that has been rising recently, and that is home and renters' insurance.
Just as for car insurance (which we'll discuss below), home insurance only rises after the prices of homes and home maintenance have already increased. Today, after the spike in home prices in 2021 and 2022, the higher costs of claims payouts is forcing insurers to raise their premiums for homeowners.
Of course, the lagging nature of both shelter CPI and home insurance costs is more of an accidental correlation than causative.
Shelter CPI is far more determined by "owners' equivalent rent" and "rent of primary residence," both of which lag real-time rent changes by about a year, while home insurance has only a small weight within the broader shelter component.
Transportation Services
Finally, we get to the transportation services component of CPI, which truly does reflect real-time price changes.
Transportation services costs increased 10% YoY in February, led primarily by a 21% increase in car insurance premiums.
As we discussed in last month's macro update on inflation, this increase in car insurance prices is less a "resurgence" of inflation than a ripple effect from prior increases in car prices and maintenance costs.
As claims come in, insurers' payouts go up, which then spurs them to increase premiums for insurees. Once the previous price increases for cars, car parts, and car maintenance are fully built into premium prices, auto insurance inflation should cool back down to pre-pandemic levels.
Another sub-component of transportation services that got some attention from the February report was airline fares. Airline ticket prices were up 6.6% month-over-month in February! But this price increase was almost entirely due to the increase in prices for petroleum products of 4.3% MoM.
If you look at the long-term chart of nominal (read: not inflation-adjusted) airline fares, the current level after February's 6.6% jump is about the same as it was right before COVID-19 began.
That's right. There has been zero inflation in airline ticket prices over the four years, according to the government's measurements.
There have been plenty of price movements, to be sure. But according to the CPI, airline tickets are roughly the same price today as they were in February 2020.
Moreover, airline fares are about 16% below their peak level from March 2013.
In any case, airline fares make up only 0.8% of the overall CPI compared to motor vehicle insurance's 2.8% weighting and motor vehicle maintenance & repair's 1.2% weighting, so even if airfares continue rising, it doesn't necessarily portend a resurgence in overall inflation.
And, of course, like other components of the CPI, airfares largely move in tandem with the price of oil. While we are not qualified to speculate about future movements of the price of oil, we would note that the CPI's gasoline metric is roughly back to where it was a decade ago, before the fracking revolution caused the price of oil to collapse amid a supply glut.
While we can't predict whether the price of oil will go higher, lower, or remain rangebound, it's useful to note that it is not currently making a resurgence that would cause a broader resurgence in inflation.
Bottom Line
Disinflationary trends are thoroughly entrenched in all the major categories of the CPI, such as shelter (36% of the CPI), food (13.5% of the CPI), and non-food and energy commodities (18.8% of the CPI).
Prices for non-food/energy commodities, a category that includes a wide swathe of items from furniture to various household goods, soared in 2021 and 2022 but have since cooled back to their pre-pandemic trend of mild deflation.
While this category of the CPI is seeing some weakness associated with very low home sales volume, it's important to note that mild deflation is not a new phenomenon for non-food/energy consumer goods.
Aside from shelter CPI, car insurance, and (arguably) gasoline, we are seeing disinflationary trends continue across most of the economy.
While it is frustrating that the broader disinflationary trend does not immediately show up in the CPI, we should gradually see the headline CPI number come down as shelter CPI (blue line) slides down toward CPI ex-shelter (red line).
Waiting for this gap to close requires patience, but we believe that it will close over the course of 2024.
As it does, the Fed will gain the confidence to cut rates and perhaps also halt quantitative tightening, which should in turn allow long-term interest rates to come down.
As interest rates come down, REITs should come back into favor in the market.
We continue to believe that the balance of 2024 should be very good for REITs.
Finally, please note that this is a free article from High Yield Landlord. If you found it valuable, consider joining our service for a 2-week free trial. You'll gain immediate access to my entire REIT portfolio, real-time trade alerts, exclusive REIT CEO interviews, and much more. We are the largest and highest-rated REIT investment newsletter online, with over 2,000 paid members and more than 500 five-star reviews.
We spend 1000s of hours and over $100,000 per year researching the market for the most profitable investment opportunities and share the results with you at a tiny fraction of the cost.
Get started today - the first 2 weeks are on us:
Sincerely,
Jussi Askola & Austin Rogers


